| Long-Term Price Case | $645/t K2SO4 |
| Flagship Project | Sevier Playa |
| Ownership | 100% |
| Mineral Reserves | 7,734,000 tonnes |
| Shares Outstanding | 348,594,751 |
| Market Cap | $40,785,586 |
| Average Annual Production | 205,700 tonnes |
| Recovery | 80% |
| Payable Product | 6,171,000 tonnes |
| LoM | 30 Years |
| True All-in Cost (TAIC) | $424/t |
| Gross Revenue | $3,980,295,000 |
| Royalties | ($222,896,520) |
| Net Revenue | $3,757,398,480 |
| Total Operating Costs | ($1,372,677,240) |
| Operating Cash Flow | $2,384,721,240 |
| Income Taxes | ($372,016,513) |
| Total Capital Costs | ($646,489,167) |
| Net Income | $1,366,215,560 |
| Net Profit Margin | 34% |
| Absolute Cost Structure (ACS) | 66% |
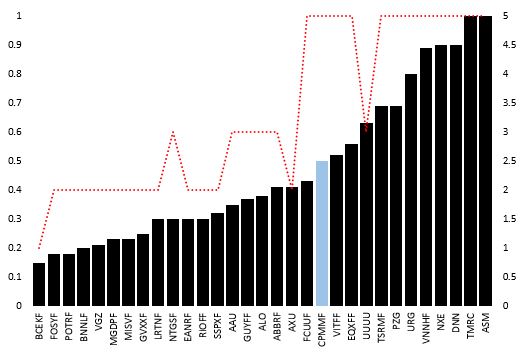
| MTQ Score (Higher is Better) | 0.5 |
| True Value | $3.92/sh. |
| True Value Discount (TVD) | 97% |
| Cash Flow Multiple | 10x |
| Net Annual Cash Flow | $45,459,700 |
| Future Market Cap | $454,597,000 |
| Future Market Cap Growth | 1,015% |
| Target | $1.30/sh. |
Notes: All Values in U.S. Dollars
Crystal Peak Minerals is a top-rated stock with an MTQ Score (0.5) that is above average and a Composite Rating of 5 (Scale of 1-5).
Above $600/t K2SO4, Crystal Peak Minerals will enjoy both a Net Profit Margin > 30% and an Absolute Cost Structure below 70%.
MTQ Score (+ Composite Rating [Red Dotted Line]) — Study Group Comparison