When betting, we look for an intersection between value and good odds. Value, you will recall from Part I, is determined by identifying a clear discrepancy between benchmark implied probability and case study implied probability, where the odds against a trade are lower in the case study than in the benchmark.
Coeur Mining is an interesting case study, as we have a lot of historical data with which to work. This enables the Odds Engine to report statistics with a high level of confidence.
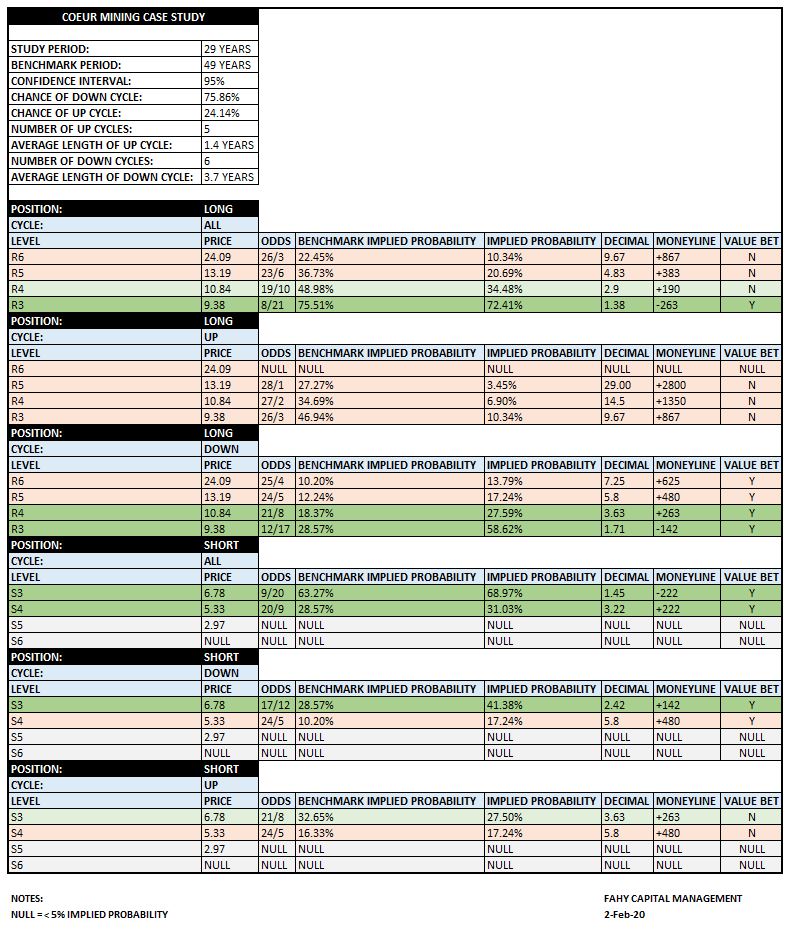
Let’s begin with some foundational statistics:
The period over which data was analyzed was 29 years. Over that period of time, Coeur experienced 11 cycles, 6 of which were down cycles and 5 of which were up cycles. The average down cycle lasted 3.7 years while the average up cycle lasted 1.4 years. In other words, Coeur shares trade in a down cycle 75.86% of the time.
Counterintuitively, value bets are not to be found on the long side in up cycles, which undercuts the old saying, ‘the trend is your friend.’ Rather, the long trades with the best odds and highest implied probability of success occur at the tail end of down cycles of the typical length. Interestingly, the reverse is not true for playing the short side. Short bets with the best odds require that one is willing to aim for a modest target while trading good size in a down cycle. Value diminishes quickly beyond the S4 price point.
A quick aside: The algorithm with which we calculate price points R6-R3 and S3-S6 is proprietary. Without that algorithm, we would not have a functioning Odds Engine, and for obvious reasons, we can’t share the math. We publish the Engine results in an effort to give readers a sense of our process — a process that enables us to see what the fundamental data available to the public doesn’t say.
There is a means by which one may trade when the odds are in one’s favor a high percentage of the time. This means that one is trading with the house against the general public as well as against contrarians — both segments of the betting population with a penchant for betting on their favorites at almost always the wrong time. They bet their favorite at what they thought was the bottom, only to find it was the middle of a down cycle. They bet their favorite when the cycle finally turns up, only to find that the bet was made at or near the top. Both groups have a poor understanding of the implied probability of virtually every trade they enter and the house eats them for lunch.
Betting isn’t easy: Humans weren’t designed to play the odds effectively, as the odds rarely conform to one’s expectations of what is logical. Wise guys know this and keep an eye out for the bets the public deems sure things — because the public thinks of their favorites as logical winners and the logical winners rarely defy the odds. Hence, we look for those price points where probability and value intersect.
Discovering those price points that represent value at good odds is a laborious, pain-staking process. And if one isn’t willing to put in the time to develop a method and process for betting well a little over 50% of the time (hopefully a little higher), one’s probability of success will be low.
You aren’t betting horses…
Just like at the track, when betting stocks by buying shares, you are betting against everyone else. But that’s where the similarity with horse betting ends. The payouts for favorites at the track are typically pretty dismal. Only squares bet on the favorite all day long. You can win all day at the track betting favorites and not ever be able to pay your mortgage.
With stocks, however, one can, and I dare say should, bet on the price point with the best odds, where value is glaring. But in order to ensure that the payout is satisfactory, particular attention must be paid to position size. To succeed long-term, one’s goal cannot be the price points with a low implied probability of success, especially if dismal odds are required to compensate for a small position.
More in Part III.